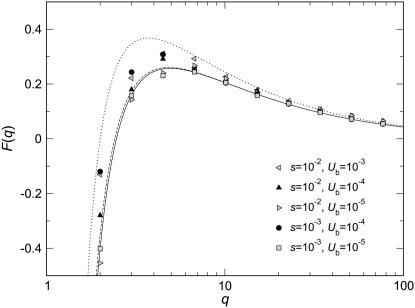
Figure 3.—
Measured values  collapse onto a single scaling function F(q). Data points are simulation results obtained from stochastic-edge simulations. For each parameter setting, we measured
  and then plotted
  as a function of q. The solid line represents a numerical evaluation of Equation 52 and the dashed line represents the approximate analytic expression Equation 53. The dotted line is the scaling function
  derived from Equation 57.

