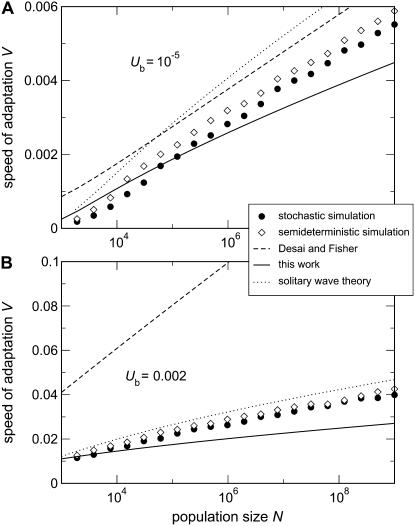
Figure 4.—
Speed of adaptation as a function of population size N. Points are simulation results: the solid circles come from stochastic simulations of the full model, while the open diamonds come from semideterministic simulations where only the best-fit class is stochastic. Dashed lines were obtained by numerically solving Equations 36 and 39 of Desai and Fisher (2007). Solid lines were obtained by numerically solving Equations 54 and 60 in the present work. Dotted lines are Equation 52 (for A) and Equation 51 (for B) from Rouzine et al. (2008). Parameters are s = 0.01 and Ub = 10−5 (A) and s = 0.01 and Ub = 0.002 (B). Note that our simulation results are in excellent agreement with simulation results reported by Desai and Fisher (2007).

