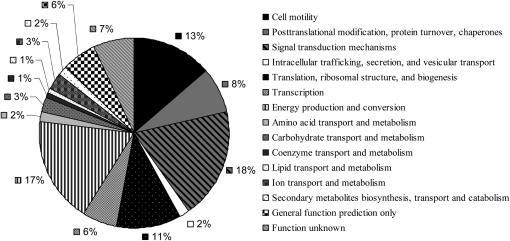
Figure 2.—
Distribution into eukaryotic orthologous groups of the 118 clones on the microarray whose mRNAs exhibited at least a twofold change in abundance. Also included is the RACK1 clone, which showed no differential expression. Categories listed in the key correspond to sectors of the graph shown clockwise from the top. The largest eukaryotic orthologous groups included cell motility (13%), energy production and conversion (17%), and signal transduction mechanisms (18%).

