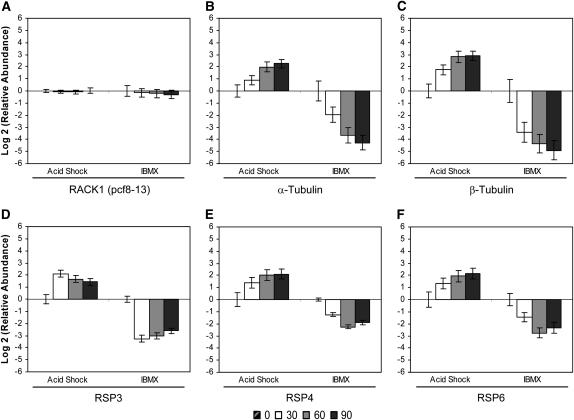
Figure 3.—
Change in relative mRNA abundance of cell-motility genes during flagellar assembly (acid shock) and disassembly (IBMX) as measured by qRT–PCR. Relative abundance for each gene was determined by the 2−ΔΔCt method. Fold change and standard error were log transformed for graphical representation. (A) RACK1 (pcf8-13) showed no change in relative mRNA abundance during flagellar assembly or disassembly and was used as the endogenous control for calculation of relative abundance. Changes in relative mRNA abundance for time points 30, 60, and 90 min after stimulation, standardized to untreated cells, were determined for (B) α-tubulin, (C) β-tubulin, (D) RSP3, (E) RSP4, and (F) RSP6.

