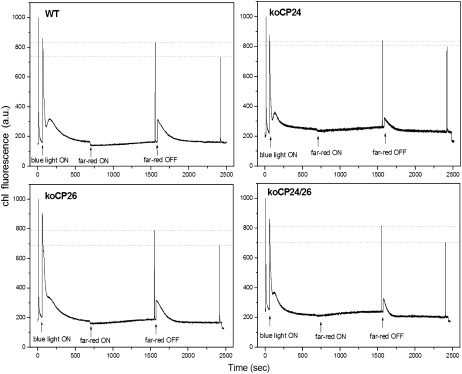
Figure 11.
Measurement of State 1–State 2 Transitions.
Plants, upon dark adaptation for 1 h, were illuminated with blue light (40 μmol m−2 s−1, wavelength <500 nm) for 15 min to reach State II. Far-red light source was used to induce transition to State I. Values of Fm, Fm′, and Fm″ were determined by light saturation pulses (4500 μmol m−2 s−1, 0.6 s).

