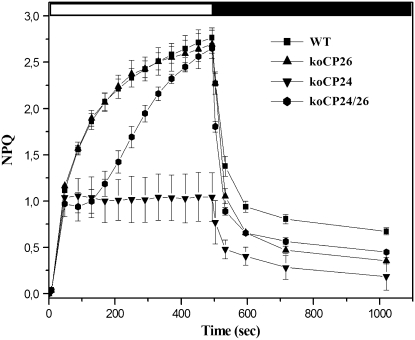
Figure 5.
NPQ Analysis of Wild-Type and Mutant Genotypes.
Kinetics of NPQ induction and relaxation were recorded with a pulse-amplitude modulated fluorometer. Chlorophyll fluorescence was measured in intact, dark-adapted leaves, during 8 min of illumination at 1260 μmol m−2 s−1 followed by 9 min of dark relaxation. All NPQ values of mutant plants after 530 s (dark recovery) are significantly lower than the corresponding wild-type values (means ± sd, n = 4, Student's t test, P < 0.05).

