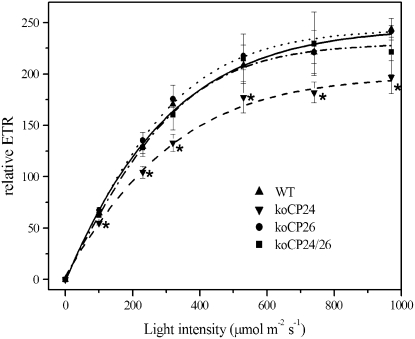
Figure 7.
ETR Measurements.
Relative ETR as a function of quantum flux density of PAR was measured fluorometrically in light-adapted leaves under saturating CO2 (1%). Data represent an average of five to eight independent measurements and are expressed as mean ± sd. Significantly different values from the wild type (P < 0.05, Student's t test) are marked with an asterisk.

