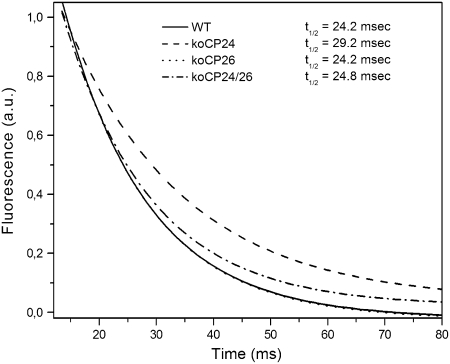
Figure 9.
QA− Reoxidation Kinetics.
Chlorophyll fluorescence decay kinetics were measured after single-turnover flash illumination in dark-adapted leaves. Drawn lines are fits for the experimental data points. Experimental fluorescence curves were normalized to the corresponding Fm values and represent averages from 12 separate experiments. The experimental data set is shown in Supplemental Figure 6 online.

