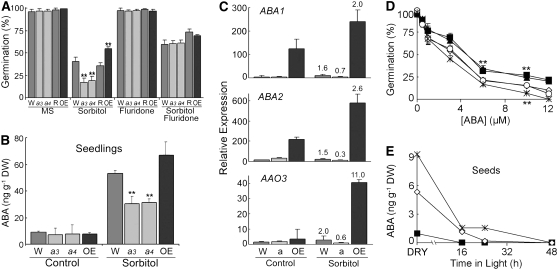
Figure 2.
Altered ABA Phenotypes of ATHK1 Alleles.
Wild-type (W; dark-gray bars or open diamonds), athk1-3 (a3; light-gray bars or closed squares), athk1-4 (a4; light-gray bars or closed trianges), athk1/ATHK1 rescued (R; dark-gray bars or open circles), and a 35S:ATHK1 overexpressor (OE; black bars or asterisks) were used for these assays. Error bars represent the se. Stars above data points represent significance based on a two-tailed t test (* P < 0.01; ** P < 0.05).
(A) Effect of the ABA inhibitor fluridone on osmotic sensitivities of ATHK1 alleles. Seeds from matched lots were germinated on Murashige and Skoog (MS) media ± 300 mM sorbitol and ± 100 μM fluridone. Each value represents the mean percentage of germination after 5 d of stress treatment for five replicates of at least 50 seeds.
(B) ABA levels in vegetative tissues of wild-type and ATHK1 mutants. Five-day-old seedlings were exposed to water ± 300 mM sorbitol for 16 h. Each value represents the mean ABA level of three independent biological replicates.
(C) Expression levels of the ABA biosynthetic genes ABA1, ABA2, and AAO3 assayed by qRT-PCR. Five-day-old seedlings were exposed to water ± 300 mM sorbitol for 16 h. All values were normalized to the actin control ACT2 gene. Bars represent the relative mean expression level from five PCR reactions. Printed numbers represent the fold change over a control sample from the same genotype. Error bars represent the se.
(D) Altered ABA sensitivities in germination of ATHK1 alleles. Seeds from matched lots were germinated on MS media ± ABA. Each value represents the mean percentage of germination after 5 d of ABA treatment for four replicates of 100 seeds.
(E) ABA levels in wild-type and ATHK1 mutant seeds. Samples were collected from dry seeds (0 h) and seeds after 16, 24, and 48 h of imbibition. Each value represents the mean ABA level of four independent biological replicates.

