Figure 7.
Phenotypic Characterization of int1.1 and int1.2 Mutant Plants.
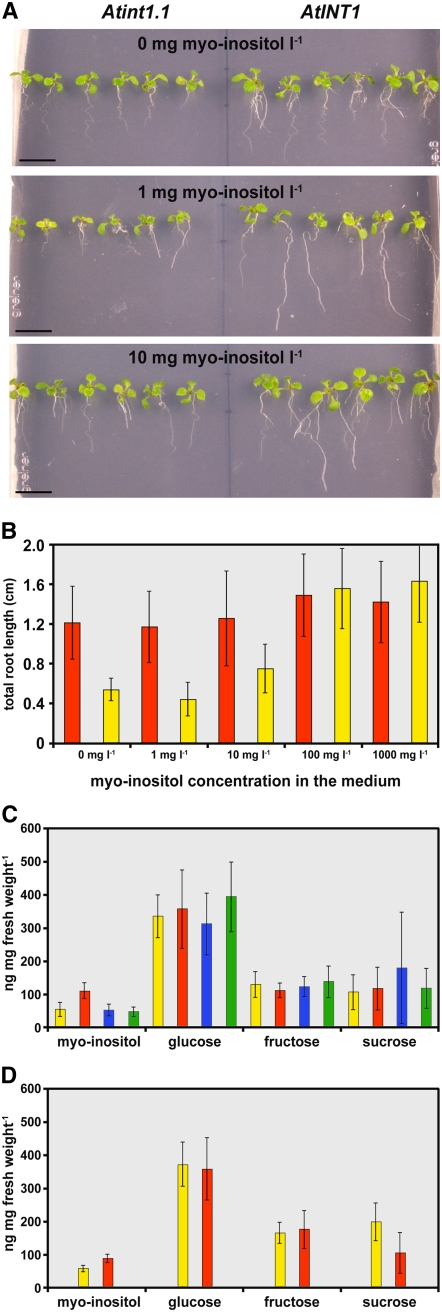
(A) Comparison of the root growth of int1.1 and wild-type seedlings (14 d old) on synthetic medium supplemented with the indicated concentrations of myo-inositol (mg/L).
(B) Quantitative analysis of root lengths of int1.1 (yellow) and wild-type (red) seedlings (10 d old) on synthetic medium supplemented with the indicated concentrations of myo-inositol (n = 12; ±sd).
(C) Comparison of myo-inositol, glucose, fructose, and sucrose concentrations in ethanol extracts from rosette leaves of int1.1 plants (red), of wild-type plants (yellow), and of int2.1 (blue) and int4.2 (green) mutant plants (n = 9; ±sd) that were grown, harvested, and analyzed in parallel.
(D) A similar data set for extracts (n = 10) of independently grown and analyzed int1.2 (red) and wild-type (yellow) plants. The significance of the difference between the inositol concentrations in int1.2 and wild-type extracts was tested with Student's t test (P = 4 × 10⁻⁶).

