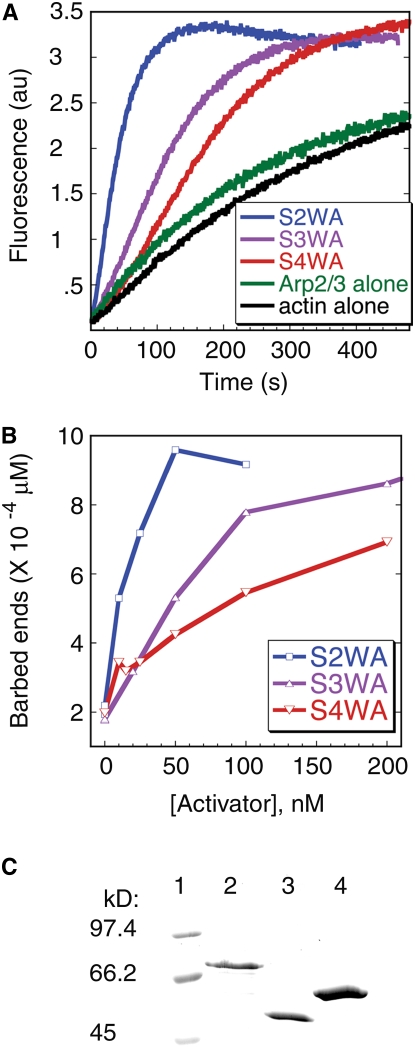
Figure 7.
ARP2/3 Activation Efficiency of SCAR2, SCAR3, and SCAR4 WA Domains.
(A) Kinetic analysis of actin polymerization in the presence of ARP2/3 was monitored with the indicated GST-tagged activator protein, 3 μM actin (5% pyrene-labeled), and 10 nM bovine ARP2/3 complex.
(B) Comparison of the concentrations of barbed ends generated at half-maximal polymerization in the presence of varying amounts of GST-SCAR2-WA, GST-SCAR3-WA, and GST-SCAR4-WA. SCAR2-WA's end concentration plot typically saturates at 50 nM SCAR2-WA at 10 × 10−4 μM ends and then decreases at higher concentrations. SCAR3-WA's end concentration plot saturates at 1 μM SCAR3-WA at ∼20 × 10−4 μM ends and then decreases by ∼25% at 3 μM SCAR3WA. SCAR4-WA's end concentration plot saturates at 1.5 μM SCAR4-WA at ∼7 × 10⁻⁴ μM ends.
(C) Coomassie blue–stained SDS-PAGE gel showing molecular size standards (lane 1), GST-SCAR2-WA (lane 2), GST-SCAR3-WA (lane 3), and GST-SCAR4-WA (lane 4).

