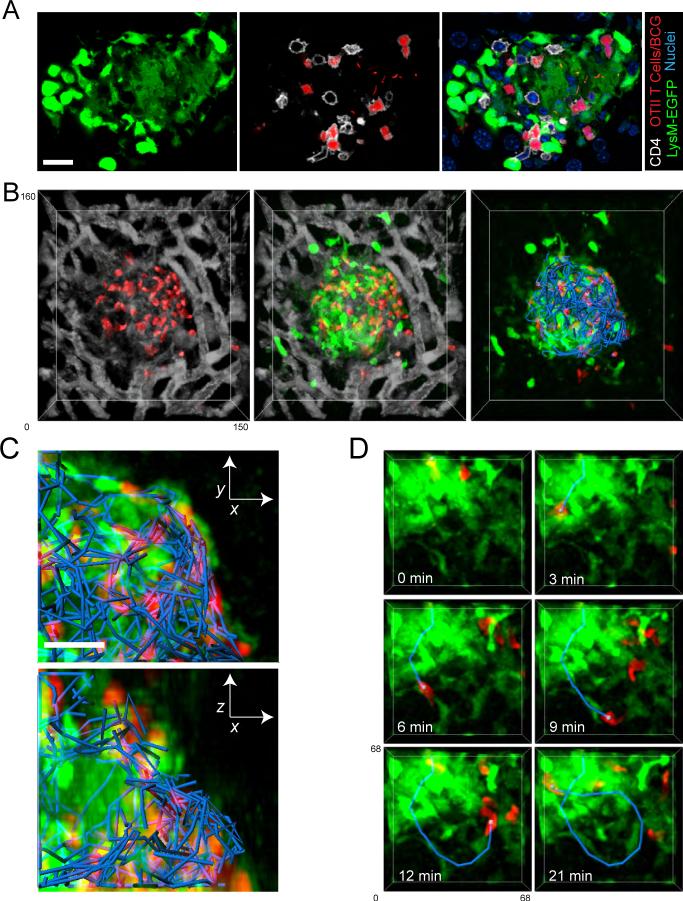
Figure 7. T cell migration within granulomas is defined by a macrophage-delineated border.
A) CMTPX-labeled in vitro stimulated OT-II T cells (red) were transferred into LysM-EGFP mice (green) that had been infected with BCG-RFP bacteria 3 weeks earlier. Twelve hours later, livers were fixed, sectioned and stained with an antibody to CD4 (white) and a nuclear dye (blue). Scale Bar, 15μm B) CMTPX-labeled in vitro stimulated OT-II T cells (red) were transferred into LysM-EGFP mice (green) that had been infected with BCG-RFP bacteria 3 weeks earlier. Twelve hours later, BSA-647 (white) was injected into the animals to visualize the sinusoidal network and hepatic IVM was performed. A single time point from a 4D data set showing T cells in relation to sinusoidal network (left panel), T cells in relation to macrophages (middle panel), and T cell migration paths (blue) in relation to macrophages (right panel). See also Movie S17. C) XY (top panel) and XZ (bottom panel) projection images from the upper right quadrant of the granuloma from part A showing T cell paths (blue) in relation to macrophages (green). D) Intravital snapshots of a T cell migrating along macrophage processes that extend from the granuloma. See also Movies S18 and S19.

