
Figure 5. Direct effects of axitinib on 9L tumor cells.
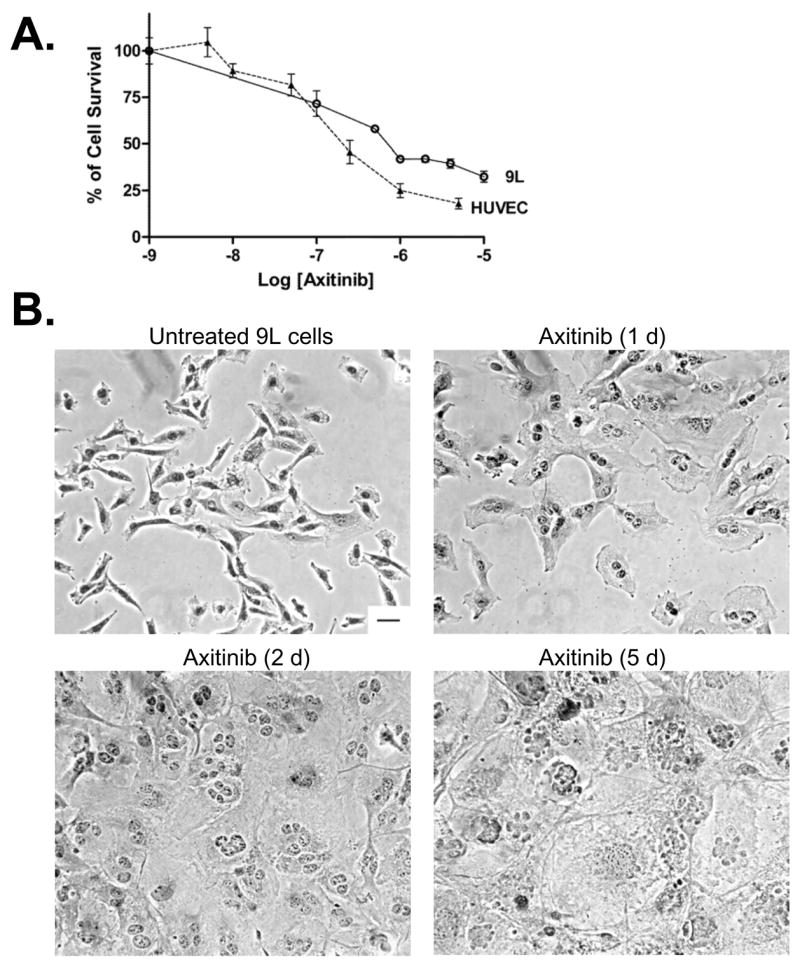
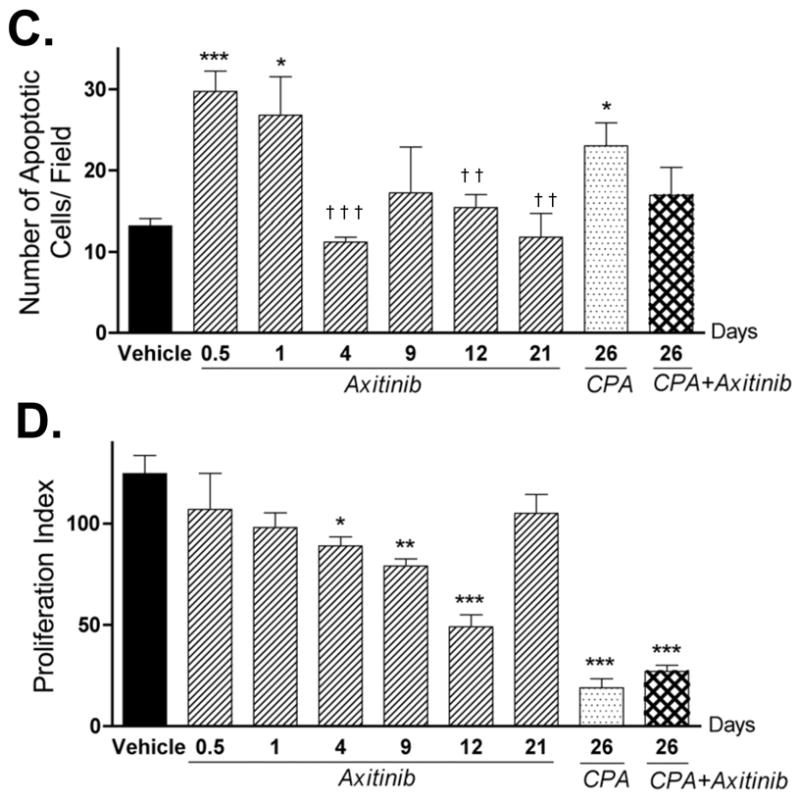
A. Cultured 9L tumor cells and HUVEC cells were treated with axitinib at the indicated concentrations for 4 d and the impact on final cell number, indicative of relative growth rate, was determined by crystal violet staining (n = 3 replicates/data point). B. Morphology of hematoxylin-eosin stained 9L cells treated with axitinib (500 nM) for up to 5 d in culture. Scale bar at bottom right of untreated cells panel applies to all graphs, 50 μm. The impact of the indicated in vivo drug treatments on tumor cell apoptosis (C) and proliferation (D) was analyzed by TUNEL assay and PCNA immunostaining, respectively. The number of staining-positive cells was counted at 200x magnification. Numbers along the x-axis indicate the time period of drug treatment. * p < 0.05, ** p < 0.01, and *** p < 0.001 compared to day 0 controls, while † p < 0.05, †† p < 0.01, and ††† p < 0.001 compared to the response at 12 hr (day 0.5), n = 4 tumors/group.