
Figure 6. Expression of mouse TSP-1 RNA after multiple drug treatments.
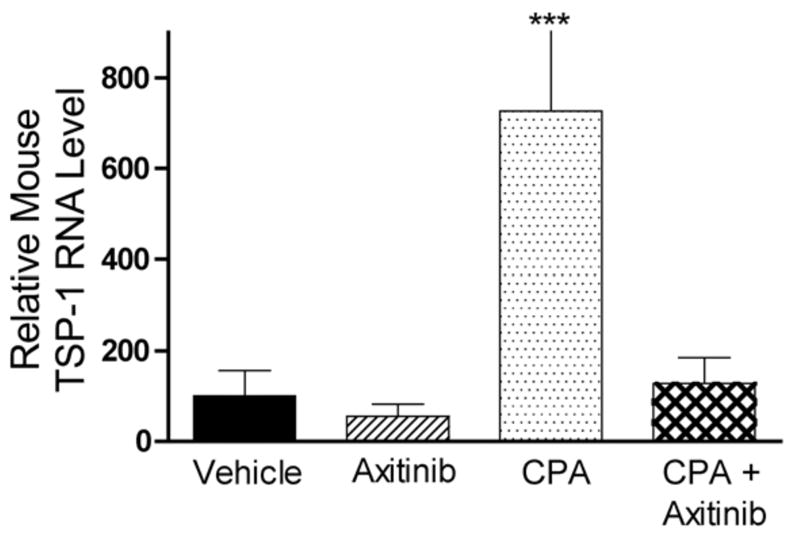
The level of host (mouse) TSP-1 RNA in 9L tumor was measured by real-time PCR following treatment with axitinib (25 mg/kg, i.p., sid for 21 d), metronomic CPA (140 mg/kg, i.p., every 6-d for 26 d) or the combination (26 d). Metronomic CPA induced a 7-fold increase in mouse TSP-1 expression, which was absent in axitinib or the combination therapy-treated tumors. Data are expressed as relative RNA levels, mean ± SE for n = 4–8 individual tumors/group.