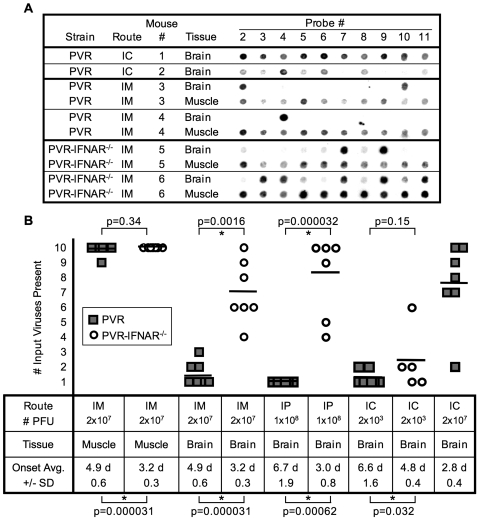
Figure 2. Viral diversity in injected PVR mice and PVR-IFNAR−/− mice.
(A) PVR mice were injected intracerebrally (IC) and intramuscularly (IM) with 2×10⁷ PFU of the ten-virus pool, tissues were harvested upon disease onset, and viral diversity in brain and muscle was determined and compared to PVR-IFNAR−/− mice injected IM. Blots derived from two representative viral-derived RT-PCR products are shown per condition, with specific probes numbered along the top. (B) Number of input viruses present in tissues from IM, intraperitoneally (IP), or IC-injected PVR mice and PVR-IFNAR−/− mice. Data from experiments shown as representative examples in panel A and additional experiments, are compiled to display results from at least 5 mice per condition. PVR mice, gray squares; PVR-IFNAR−/− mice, open circles. Horizontal bars denote the average for each group. The average time of symptom onset (day post-inoculation) +/− standard deviation is shown at the bottom. The p values from Student's t test are shown: values above the graph compare viral diversity among indicated samples, values below the graph compare disease onset time among indicated samples. An asterisk denotes statistical significance (p<0.05).

