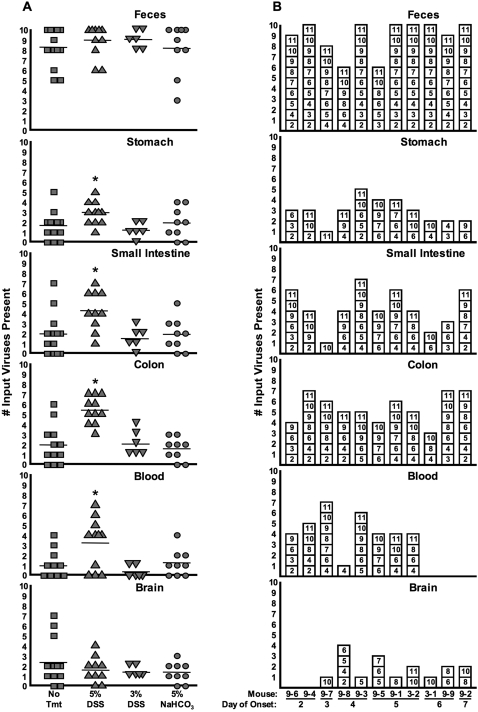
Figure 6. Viral diversity in tissues from orally inoculated untreated, DSS-treated, and antacid-treated PVR-IFNAR−/− mice.
Samples from the mice described in Figure 5 were subjected to the hybridization-based diversity assay. (A) Number of input viruses present, compiled from the hybridization-based assay, in different tissues and feces from untreated, 5% and 3% DSS-treated, and antacid (5% NaHCO3)-treated PVR-IFNAR−/− mice. Averages are represented by horizontal lines. Asterisks indicate statistically significant differences between untreated and 5% DSS-treated mice (p<0.05, Student's t test; see text for exact p values). (B) Viral diversity in tissues of 5% DSS-treated mice. Shown here are individual viruses found in each tissue at disease onset and feces collected on day one post-inoculation. Each box depicts a particular virus detected following hybridization of probes, based on blot results. Mice are arranged in order of earliest to latest disease onset. It is likely that the first two mice, 9-6 and 9-4, succumbed to DSS treatment rather than poliovirus since no virus was detected in the brain of these animals.

