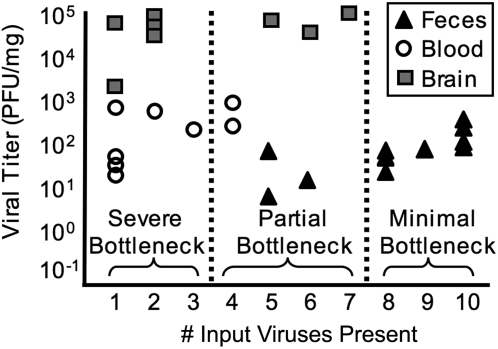
Figure 7. Bottlenecks revealed by comparing viral titer vs. diversity.
Samples from untreated, orally inoculated PVR-IFNAR−/− mice were compared by graphing viral titer (see Figure 5C–F) vs. the number of input viruses present (see Figure 6A). Samples with 1–3 input viruses present experienced a severe bottleneck, samples with 4–7 input viruses present experienced a partial bottleneck, and samples with 8–10 input viruses present experienced a minimal bottleneck.

