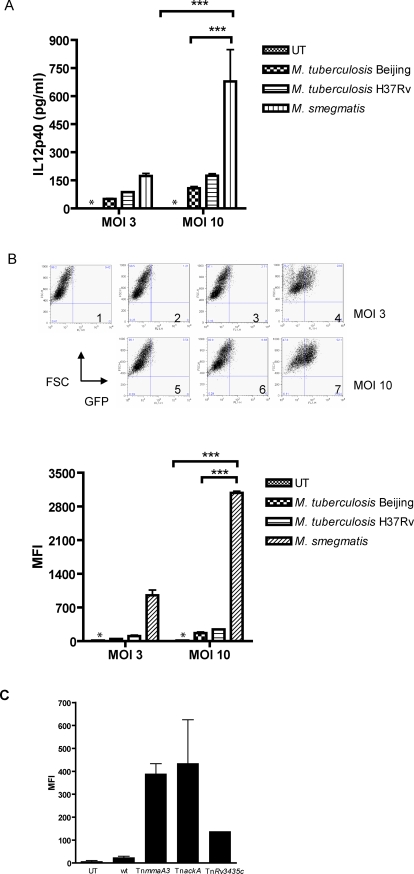
Figure 1. Macrophages infected with virulent strains of M. tuberculosis produced significantly less IL-12p40 than avirulent strain and candidate mutants.
(A) BALB/c bone marrow-derived macrophages were infected at an MOI of 3 or an MOI of 10 with virulent clinical (Beijing/W (HN878)) or laboratory (H37Rv) strains of M. tuberculosis, with the avirulent mycobacterial species M. smegmatis, or left untreated (UT). IL-12p40 from conditioned media harvested for 16 to 24 hr was analyzed by ELISA. At an MOI of 10, M. smegmatis induced significantly more IL-12p40 than virulent M. tuberculosis Beijing and M. tuberculosis H37Rv (***, p<0.001; two-way ANOVA, Bonferroni post-tests). Values are the means±SD for triplicate samples and are representative of 3 separate experiments. (*), below limit of detection. (B) Evaluation of IL-12p40 promoter activity in macrophages infected with virulent or avirulent strains of mycobacteria. The -800+55 IL-12p40-GFP Raw 264.7 cell line was infected at an MOI of 3 or 10 with virulent M. tuberculosis Beijing/W (HN878), H37Rv, or M. smegmatis, or left untreated (UT). Cells were harvested for 16 to 24 hr following infection to measure GFP expression by flow cytometry. Top: sample dot plots are shown for infections at MOI of 3 or 10, as indicated. (1) Uninfected; (2) and (5), M. tuberculosis Beijing/W (HN878); (3) and (6), M. tuberculosis H37Rv; (4) and (7), M. smegmatis. Bottom: graph of mean fluorescence intensity (MFI) values for GFP expression. ***, p<0.001 (two-way ANOVA, Bonferroni post-tests). Values are the means±SD of triplicate samples and are representative of 3 separate experiments. *, below limit of detection. (C) Transposon insertion mutants of M. tuberculosis that induced increased expression of IL-12p40 in macrophage reporter cell line. Secondary screen of expanded cultures of candidate transposon mutants. Transposon (Tn) insertion mutants in the indicated genes were used to infect the −800+55 IL-12p40-GFP Raw 264.7 cell line at an MOI of 10. Flow cytometry analysis was used to analyze GFP expression of infected macrophages. One-way ANOVA analysis showed that the difference in mean fluorescence intensity (MFI) values for the entire set was statistically significant (p<0.05). Values are the means±SD of triplicate samples and are representative of 2 separate experiments.

