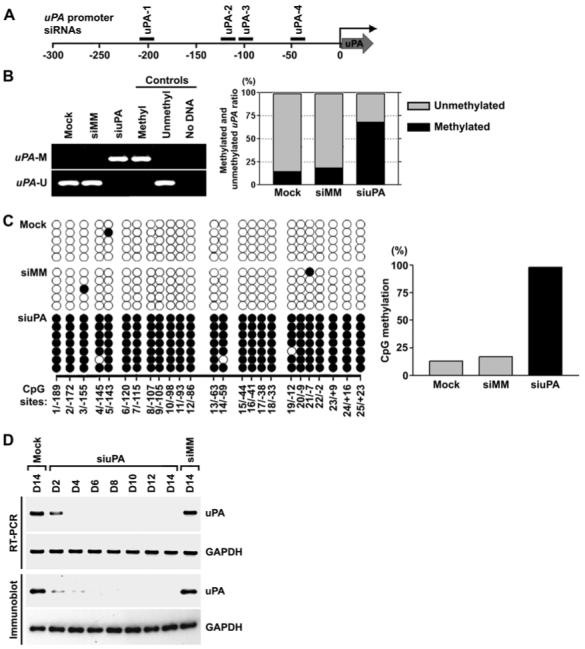
Figure 1. siRNA targeting the uPA promoter induced DNA methylation and transcriptional silencing in PC3 prostate cancer cells.

(A) Design of uPA siRNA. Locations of uPA siRNA nos. 1, 2, 3 and 4 are shown relative to the transcriptional start site (0).(B) MSP analysis of the CpG island in the uPA promoter in mock-transfected cells and in cells transfected with siuPA or siMM (left). Bisulfite-based DNA methylation analysis using quantitative real-time PCR (right). Using bisulfite-treated genomic DNAs from siRNA-transfected and mock cells, the CpG island in the uPA promoter region was PCR-amplified with methylation- or unmethylation-specific primers. Real-time PCR was used to determine the relative levels of methylated and unmethylated uPA. The PCR product amplified with methylation-insensitive primers was used for normalization. uPA-U, unmethylated PCR product; uPA-M, methylated PCR product. Positive and negative controls were described in Methods.(C) Bisulfite sequencing analysis of the CpG island in the uPA promoter in mock-transfected cells and in cells transfected with siuPA or siMM. CpG positions are indicated relative to the transcriptional start site (0); each circle in the figure represents a single CpG site. A filled circle represents a methylated CG dinucleotide, and an empty circle represents an unmethylated CG dinucleotide. Bar diagram showing the percentage of methylation in cells transfected with mock, siMM or siuPA.(D) RT-PCR (top) and immunoblot (bottom) analysis of cells transfected with mock, siMM or siuPA were collected on the indicated days (D2-D14). GAPDH was used as a loading control for RNA and protein analysis.
