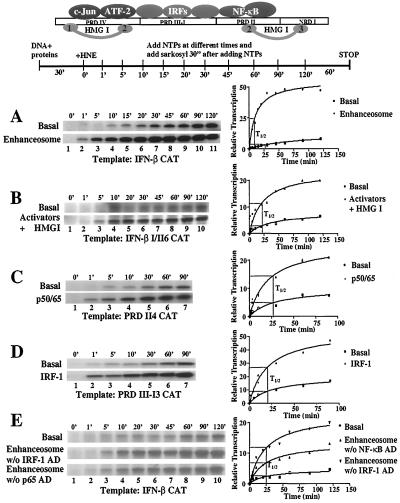
Figure 1.
The IFN-β enhanceosome stimulates the rate of PIC assembly. (A) The IFN-β enhanceosome was assembled on the wild-type enhancer (see Materials and Methods) and was incubated with a HNE for the indicated amounts of time shown at the top part of the figure. Sarcosyl and NTPs were added, and the incubations were continued for an additional 60 min. Transcript levels were detected by primer extension, quantitated by PhosphorImager, and used as a measure of PIC formation. The right part of the figure shows the relative levels of transcription plotted as a function of time along with a best-fit curve as described in Materials and Methods. Shown is one of six independent experiments. The variability from experiment to experiment for the half-time of PIC formation was <8% for the basal level and <10% for activated transcription. (B) Same as in A but the template contains half-helical DNA insertion between PRDI and PRDII (IFN-β I/II6 CAT). Shown is one of three independent experiments. The variability from experiment to experiment was <12% for the basal and activated transcription. (C) Same as in A but the template contains four copies of the PRDII element cloned upstream of the IFN-β TATA box. The activator used was NF-κB. Shown is one of three independent experiments, and the variability was <10% and <15% for basal and activated transcription, respectively. (D) Same as in A but the template contains four copies of the PRDIII-I element cloned upstream of the IFN-β TATA box. The activator used was IRF-1. Shown is one of two independent experiments, and the variability was <7% and 9% for basal and activated transcription, respectively. (E) Same as in A but the enhanceosome used at Middle lacks IRF-1’s activation domain, whereas that used at Bottom lacks p65’s activation domain. Shown is one of two independent experiments, and the variability was <8%, <10%, and 7%, respectively.

