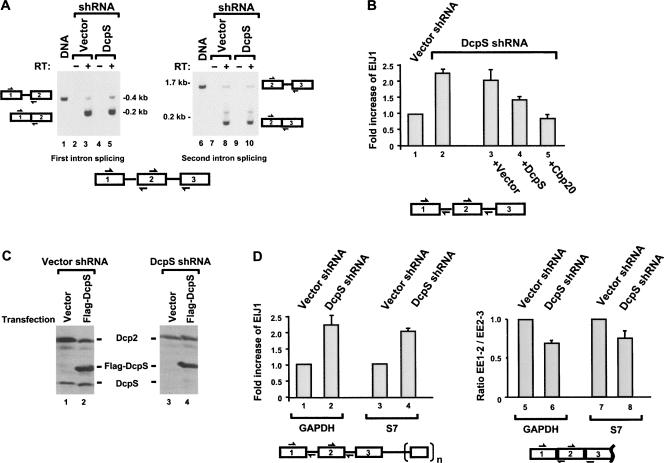
FIGURE 5.
DcpS can influence splicing of the first intron in cells. (A) DcpS affects the splicing efficiency of the rat fibronectin minigene reporter pre-mRNA first intron. Stable 293T cell line of either control empty shRNA or DcpS shRNA background was transfected with the rat fibronectin minigene and was analyzed 36 h post-transfection by reverse transcription PCR assays. Qualitative presence of intron 1 splicing (left panel) or intron 2 splicing (right panel) was determined with primer pairs that monitor the splicing status as shown in the schematic on the side of each panel and summarized at the bottom. The boxes with the numbers denote the exons and the lines represent the introns. DNA size markers are shown to the side of each panel. PCR products corresponding to the unspliced intron 1 and unspliced intron 2 obtained from amplification of the plasmid expressing the rat fibronectin transcript are shown in lanes 1 and 6, respectively. (B) Splicing reactions analogous to A were analyzed by quantitative real-time PCR using the primer sets that span the exon–intron junctions shown schematically below the panel. The EIJ1/EIJ2 ratio obtained from the control shRNA vector was arbitrarily set to one (lane 1) and all other values are presented relative to this control. A twofold increase in the detection of EIJ1 relative to that of EIJ2 is observed in the 293T-DcpSKD cells (lane 2), an indication of a preferential splicing defect in the first intron. Complementation with either the empty vector (lane 3) or vector expressing DcpS (lane 4) or Cbp20 (lane 5) is shown. Quantization of three independent experiments performed in duplicate and the corresponding standard deviation denoted by the error bars are shown. (C) Expression of Flag-DcpS in 293T-DcpSKD cells. Control and 293T-DcpSKD cells were transfected with either a vector construct or Flag-DcpS expression construct as indicated and expression of both endogenous and exogenous DcpS detected by Western analysis using a DcpS antibody. The level of Dcp2 was tested as a control. Expression of exogenous Flag-DcpS is high enough to overcome the DcpS shRNA. (D, left panel) Quantitative real-time PCR was carried out to detect the EIJ1 fold increase relative to that of EIJ2 as in B for the indicated endogenous genes from RNA obtained from the control or DcpS-specific shRNA expressing 293T cell lines. The exons and introns are schematically shown on the bottom with n = 6 for GAPDH and n = 4 for S7. GAPDH and S7 genes exhibit a twofold preferential increase of EIJ1 in 293T-DcpSKD cells (lanes 2,4) relative to control cells (lanes 1,3). (Right panel) Quantitative real-time PCR analysis was carried out analogous to that above except primers that spanned exon–exon 1–2 (EE1–2) and exon–exon 2–3 (EE2–3) were used as indicated in the schematic below and short elongation times were used such that the spliced form was exclusively detected. Quantization of three independent experiments carried out in duplicate and corresponding standard deviation denoted by the error bars are shown.

