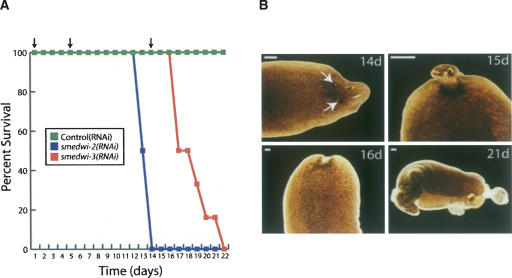
FIGURE 6.
The roles of the smedwi genes during homeostasis. (A) Survival curve for control(RNAi), smedwi-2(RNAi), and smedwi-3(RNAi) animals (n = 12) during homeostasis. (B) Phenotypes of the smedwi-3(RNAi) animals during homeostasis (n = 12) at the days indicated following the initial RNAi feeding. The arrows in the upper left panel indicate the lesions that appear in these animals (scale bars, 0.5 mm).

