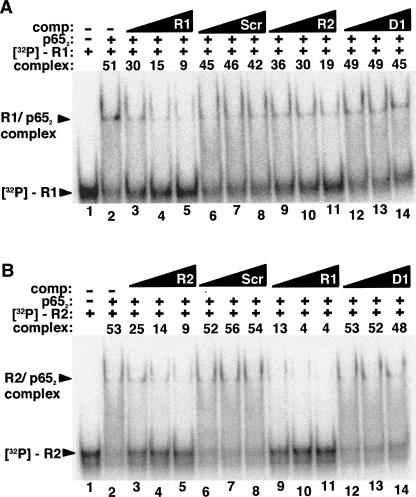
FIGURE 3.
RNA competition binding assay comparing p652 affinity for RNAs R1 and R2. (A) Labeled R1 RNA (1 nM) was incubated in the absence of protein (lane 1) or the presence of p652 alone (20 nM) (lane 2) or together with various unlabeled RNA competitors (lanes 3–14): R1 RNA (lanes 3–5), 83 nt scrambled RNA (lanes 6–8), R2 RNA (lanes 9–11), D1 RNA (lanes 12–14). Triangles indicate increasing unlabeled RNA competitor concentration (one-, two-, or fourfold molar excess [20 nM, 40 nM, or 80 nM] relative to p652 concentration). “Complex” indicates the percentage of radiolabeled probe shifted. (B) As in A, except radiolabeled R2 RNA was tested and lanes 3–5 and 9–11 are in the presence of R2 and R1 competitor, respectively.

