
Figure 1. Characterization of TNFα-induced potentiation of astrocytic NO production.
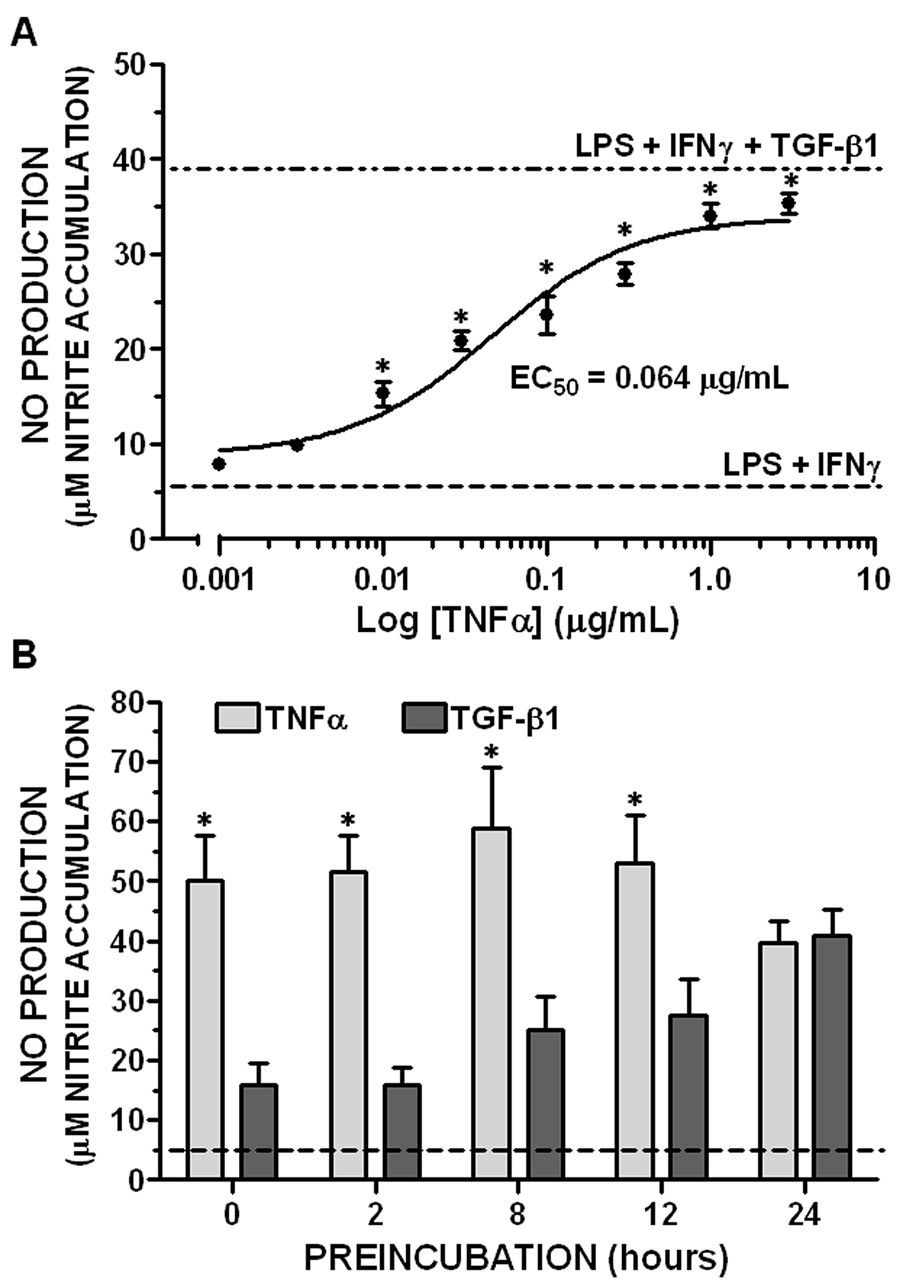
A. TNFα concentration response. Primary astrocyte monolayers were treated concurrently with LPS plus IFNγ (2 µg/mL and 3 ng/mL, respectively) and the indicated concentrations TNFα. NO production was assessed by nitrite accumulation 24 hr later as described in “Experimental Procedures” and results expressed as the mean ± SEM; n = 4–5 cultures from 2 separate dissections. Dashed line (“LPS + IFNγ”) = NO production induced by LPS plus IFNγ in the absence of TNFα. Dash-dot line (“LPS + IFNγ + TGFβ1”) = parallel cultures treated with 3 ng/mL TGFβ1 for 24 hr prior to stimulation with LPS plus IFNγ.
*, significantly different from “LPS + IFNγ” treatment group (one-way ANOVA, Dunnet’s post-test, p<0.05).
B. Effect of preincubation. Astrocyte monolayers were treated with TNFα (1 µg/mL) or TGFβ1 (3 ng/mL) for the indicated times prior to addition of LPS plus IFNγ. 0 = concurrent administration with LPS plus IFNγ. NO production (nitrite accumulation) was measured 36 hr after LPS plus IFNγ. Results are expressed as mean + SEM; n = 9 cultures from 3 separate dissections. Dashed line = stimulation with LPS plus IFNγ alone.
*, significant difference between cytokine treatment groups (two-way ANOVA, Bonferroni post-test, p<0.05).