
Figure 3. Analysis of colocalization of NOS-2 and GFAP immunoreactivity.
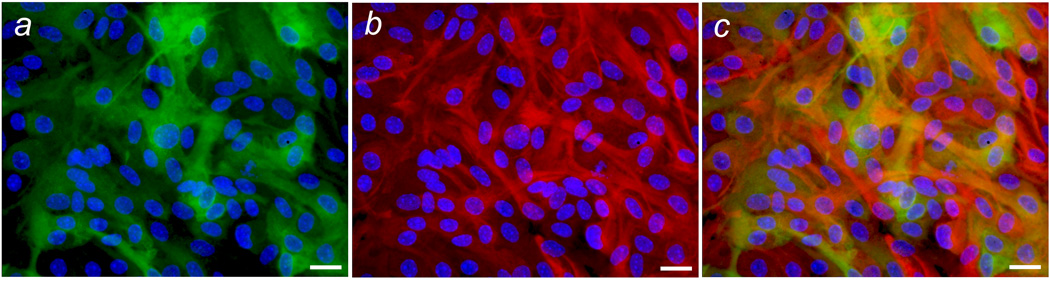
Astrocyte cultures were treated with both TNFα and TGFβ1 as described in Figure 2 and exposed to LPS plus IFNγ for 14 hr, after which NOS-2 and GFAP immunoreactivity was assessed by immunofluorescence microscopy. Representative fluorescent images for NOS-2 (green), GFAP (red) and DAPI (blue) were obtained from the same microscopic field and superimposed using Adobe Photoshop. (a) NOS-2 and DAPI; (b) GFAP and DAPI; (c) NOS-2,GFAP, and DAPI. Scale bar = 20 µm.