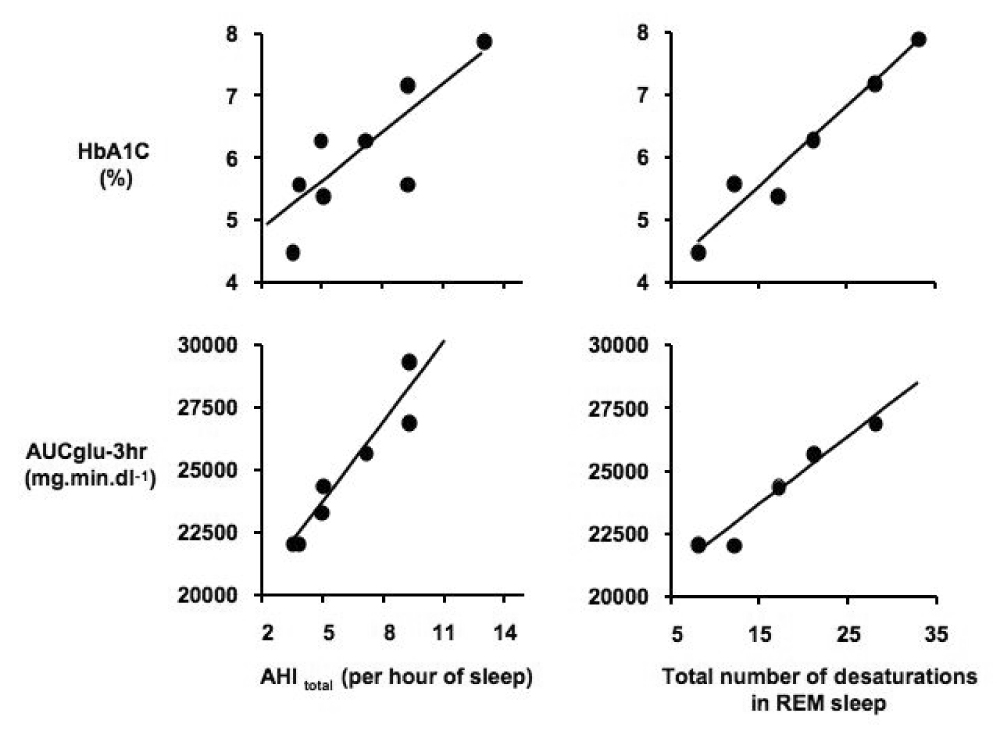
Figure 3.

Relationships between the markers of severity of sleep-disordered breathing (SDB) and measures of glucose tolerance in eight women with PCOS. Left upper panel: relationship between total apnea-hypopnea index (AHItotal) and glycosylated hemoglobin (HbA1C). Left lower panel: relationship between AHItotal and the area under the glucose curve (AUCglu-3hr). Right upper panel: relationship between total number of ≥3% desaturations in REM sleep and HbA1C. Right lower panel: relationship between total number of ≥3% desaturations in REM sleep and AUCglu-3hr. (From Tasali E, Van Cauter E, Ehrmann D. Relationships between sleep disordered breathing and glucose metabolism in the polycystic ovary syndrome. J Clin Endocrinol Metab, 2006, 91:36–42)
