
Figure 2.
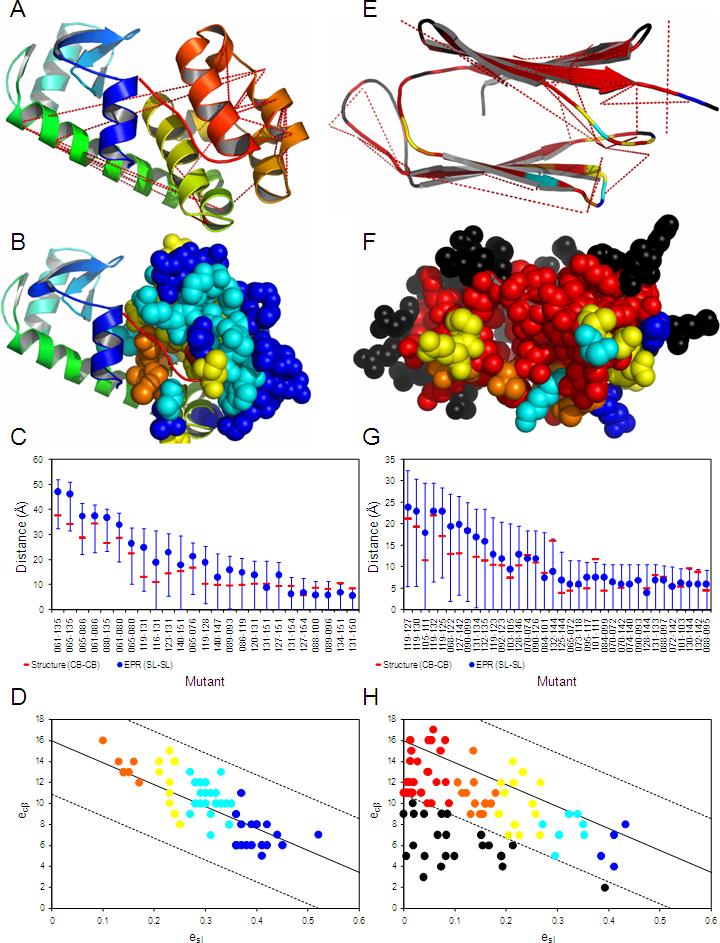
Map of the EPR restraints on the T4-lysozyme crystal structure (A-D) and on the αA-crystallin comparative model (E-H). A and E) Red dotted lines show dCβ distances, which are restrained by respective dSL. B and F) Residues for which accessibilities eSL were measured are depicted as space-filling models. C and G) Diagram shows dSL (blue circle), the range of the derived distance restraints (blue), and the corresponding crystal/comparative model dCβ (red bar). D and H) Diagram illustrating the correlation of eSL with eCβ. The lines indicate the consensus model fit ±3•σCβ, where σCβ, was recalculated based on the consensus fit to be 1.70Å. In B, F, D, and H the residues are color-coded with decreasing eSL from blue – cyan – yellow – orange – red; black indicates amino acids in αA-crystallin that show reduced experimental accessibility due to intermolecular contacts with other αA-crystallin units in the oligomeric protein.