
Figure 3.
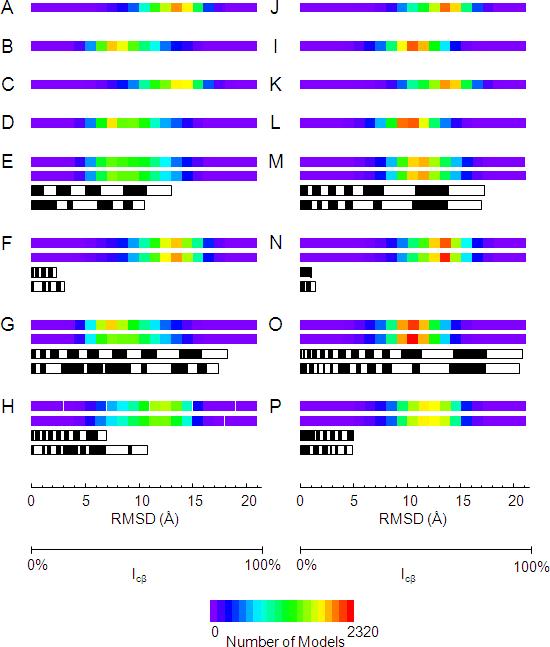
Illustration of the value of the experimental restraints in de novo protein folding for T4-lysozyme (A - H) and αA-crystallin (I - P). The backbone RMSD distribution of 10,000 T4-lysozyme de novo models created A) without the use of EPR restraints, B) with only the use of EPR distance restraints, C) with only the use of EPR accessibility restraints, D) with the use of EPR distance and accessibility restraints. E) The backbone RMSD distribution of 10,000 T4-lysozyme de novo models created with the use of 1/3 of the EPR distance restraints: top bar) those with the largest information content; second bar) those between amino acids furthest apart in sequence. The third and fourth black and white bars denote the sum percent of information content of the restraints used for the top and second bars, respectively. The width of the blocks comprising the black and white bars denotes the information content of individual restraints. F) Same as for E) but using the distance restraints with the lowest information content (top bar) and nearest in sequence (second bar). G) Same as for E) but using 2/3 of the total distance restraints. H) Same as for F) but using 2/3 of the total distance restraints. I – P) Same as A - H but for αA-crystallin.