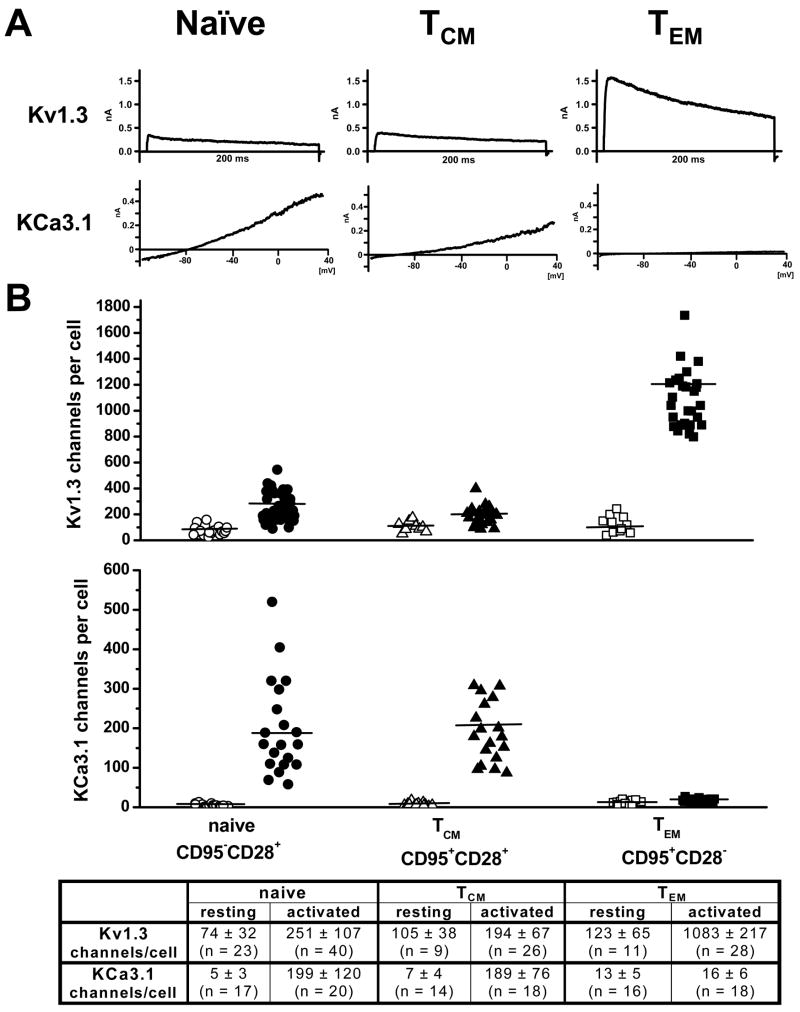
Figure 2.
(A) Representative Kv1.3 and KCa3.1 currents in activated naïve, TCM and TEM RM T cells. (B) Scatterplot of Kv1.3 and KCa3.1 channel numbers per cell in resting (open symbols) and activated (closed symbols) T cells in naïve, TCM and TEM RM T cells. Mean channel numbers (± SD) are shown in the table below the plot.

