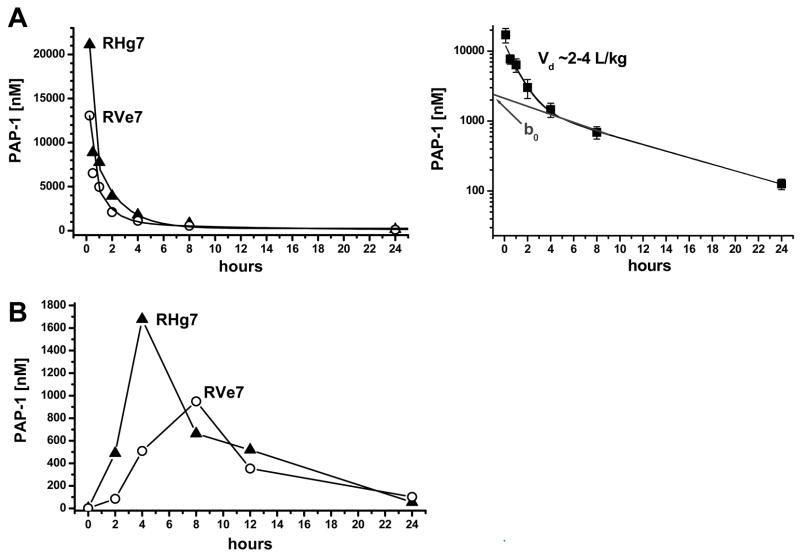
Figure 4.
Pharmacokinetics of i.v. and orally administered PAP-1 in RM. (A) Total PAP-1 plasma concentration-time profile in RM after single i.v. injection of 3 mg/kg dose (left) and log plot of averaged data used to determine the volume of distribution (right). (B) Plasma concentration-time profile in RM that were orally administered 25 mg/kg of PAP-1. Concentrations at 48 hours were 20 and 30 nM; concentrations at 7 days 10 and 3 nM.

