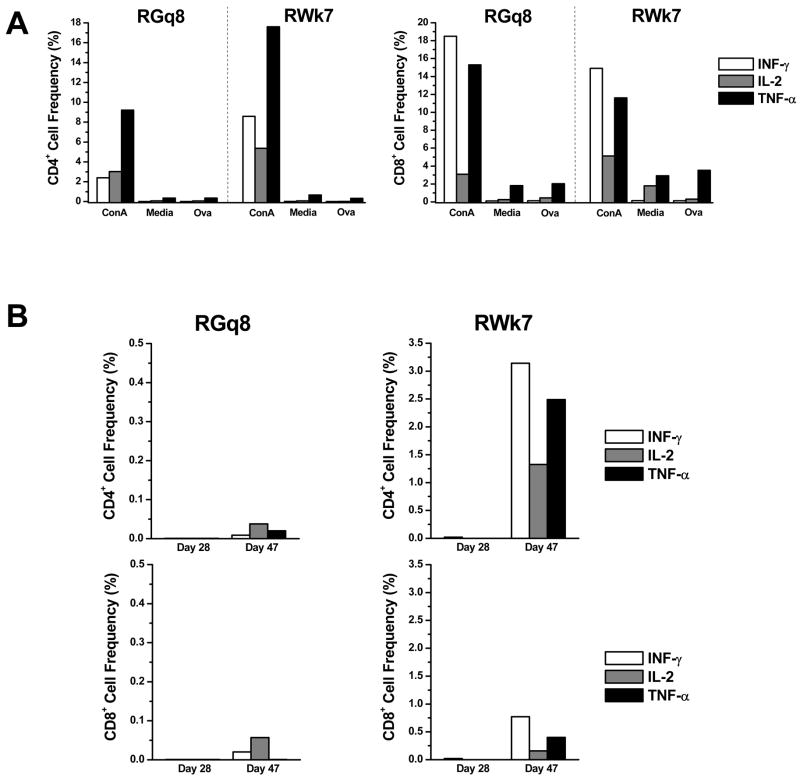
Figure 6.
Effect of PAP-1 on the flu virus-specific primary and secondary T-cell responses in RM. PBMCs that were isolated on day 28 (during PAP-1 application, post-initial flu immunization) and day 47 (after PAP-1 application, post-1st flu booster) were cultured in the presence of ConA (positive control), media (background control), Ova (negative control), and whole flu virus in the presence of brefeldin A. Cells were surface stained for CD4 and CD8 and then fixed/permeabilized and stained to detect IFN-γ (clear bars), IL-2 (dark grey bars) and TNF-α (light grey bars). The frequency of cytokine-producing CD4+ and CD8+ T-cells was determined by flow cytometry. Data shown includes (A) the CD4+ and CD8+ T-cell response to positive (ConA) and negative (media, OVA) controls in both RM on day 0 (baseline) and (B) the CD4+ and CD8+ T-cell response (corrected for media background) to the flu virus in RGq8 (left panel) and RWk7 (right panel) on days 28 and 47.

