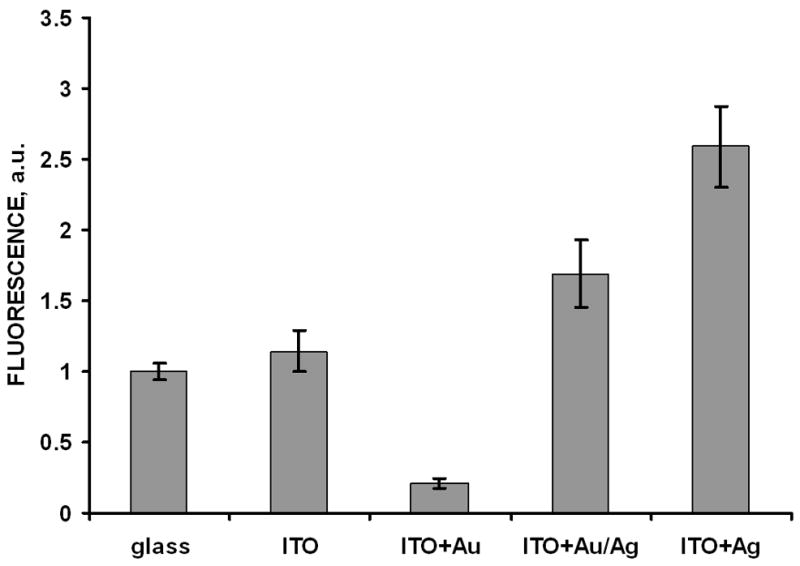
Figure 5.

Fluorescence signals of the model immunoassay (reporter Rhodamine Red-X antibodies) measured from different particle coatings of the ITO/glass slides (excitation by 532 nm laser) and glass without ITO (takes as comparison signal of 1 a.u.). Error bars represent plus/minus one standard deviation (n=5).
