
Figure 1. The TBRS associates with breast cancer metastasis in humans.
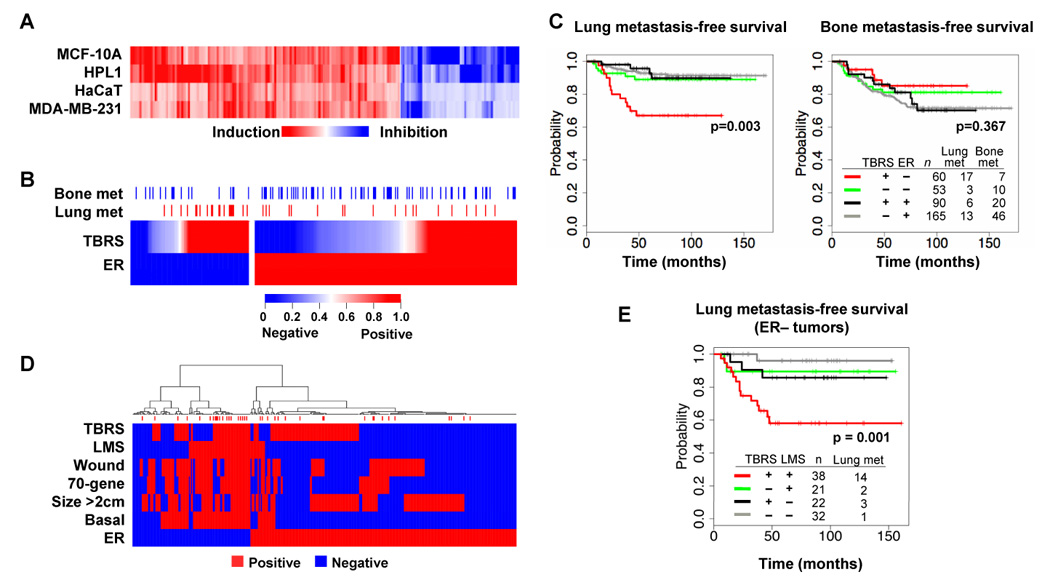
(A) The indicated epithelial cell lines were incubated for 3 h with TGFβ and then total RNA was subjected to microarray analysis. The heat map represents the change in expression levels of the 153 genes within the TBRS.
(B) TBRS status was assessed in a MSK/EMC cohort of 368 primary breast cancer tumors with known lung or bone metastatic outcomes. Red denotes a strong correlation between individual tumor gene expression profiles and the TBRS while blue indicates no correlation. Estrogen receptor α(ER) expression status is also indicated. Blue and red marks above the heat map indicate tumors that at any time developed bone or lung metastases, respectively.
(C) Kaplan-Meier curves representing the probability of cumulative lung (left panel) or bone (right panel) metastasis-free survival for this cohort. Tumors are categorized according to their TBRS and ER status. The P values for the ER-negative tumor comparisons are shown.
(D) Hierarchical clustering was performed on the MSK/EMC cohort with the indicated pathological and genomic markers including the TBRS, the lung metastasis signature (LMS), the wound response signature (Wound), the 70-gene prognosis signature (70-gene), size (Size >2cm), the basal molecular subtype (Basal), and the ER status. Red marks above the map indicate tumors that developed lung metastasis.
(E) Lung metastasis-free survival restricted to patients with ER-negative tumors. Patients were categorized according to their TBRS and LMS status. P value shown for the LMS+ tumor comparisons.