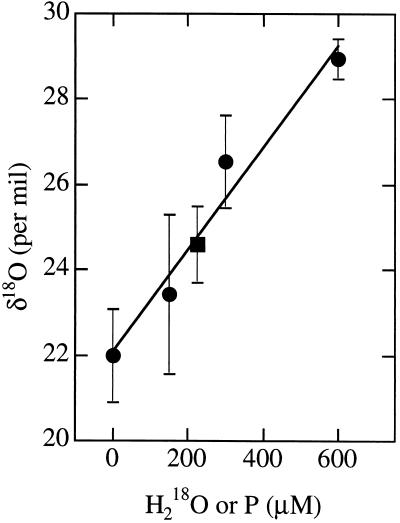
Figure 1.
Dependence of sample enrichment [δ18O] on 18O concentration for H218O (●); the solid line is a linear regression on these points. The average enrichment for the P samples vs. the concentration of P is plotted on the same graph (■). The interpolation of the mass spectrometric signal of P form onto the straight line indicates that the average H218O content of three P samples was 210 μM; the average concentration of P determined optically was 228 ± 7 μM.

