
Fig. 7. Trafficking of Epac-1 to the phagosome following PGE2 treatment.
Rat AMs were pretreated for 5 min with vehicle (DMSO) or PGE2 (1 μM), followed by challenge with IgG-opsonized magnetic beads. Phagosomal membranes were harvested at the times noted and (A) assayed by immunoblot for the late phagosomal marker flotillin and for Epac-1. Densitometry (B) presents mean (±SE) data from independent experiments.
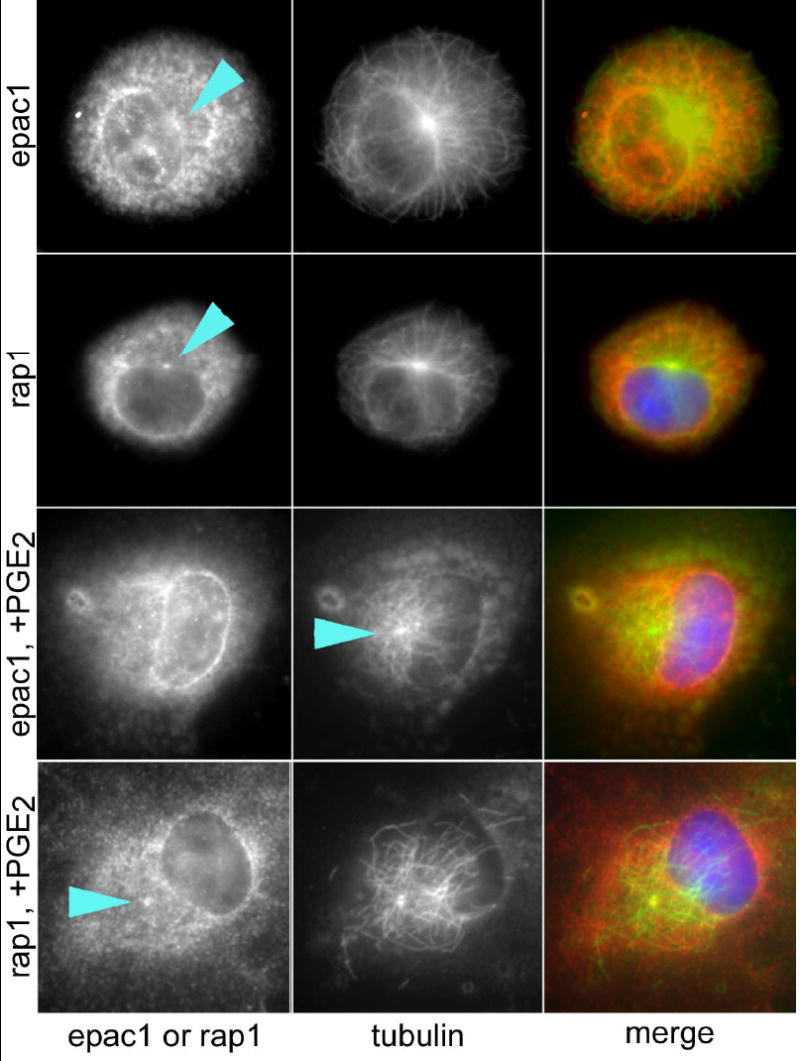
Co-localization of Epac-1 and Rap1 with MTOCs. AMs were either untreated or treated for 60 min with 1 μM PGE2 before fixing and staining for Epac-1 or Rap-1 and α-tubulin. Individual stains (left, center) are provided in black and white for optimum presentation; merged images (right) use false coloring to who Epac-1 or Rap1 as red and α-tubulin as green. The positioning of the MTOC is indicated by an arrowhead. The Epac-1 + PGE2 image is identical to that shown in Fig. 5. Results are from one experiment and are representative of three independent experiments.