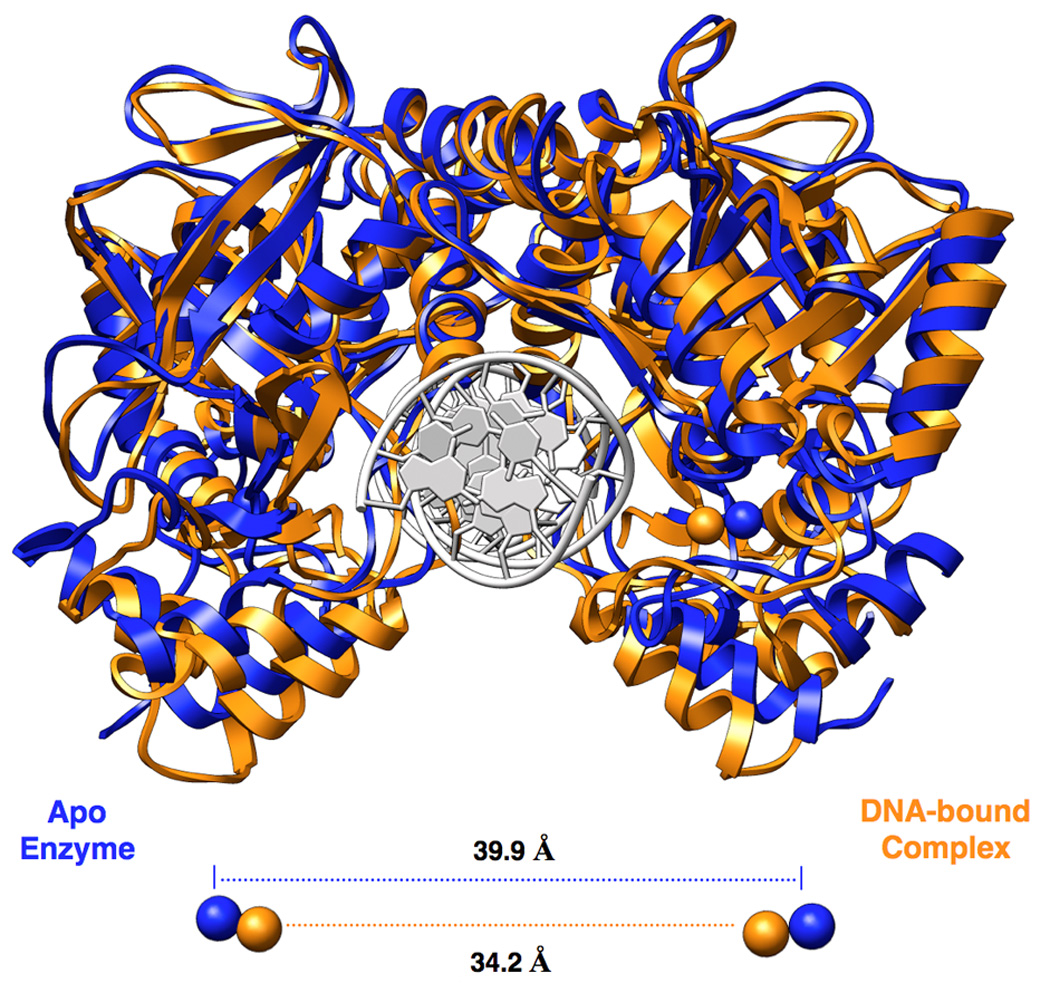
Figure 4. Conformational change due to DNA-binding.

Superposition of apo (blue) and DNA-bound (orange) NotI structures for visualization of the conformational change which takes place upon binding of DNA. A decrease in distance between iron atoms of approximately 5.7Å is observed between the two structures, illustrating the motion taking place in the metal-binding and clamp domains. Less movement is observed in the nuclease core and dimerization regions of the structure. The DNA from the DNA-bound structure is colored white and shown for reference.
