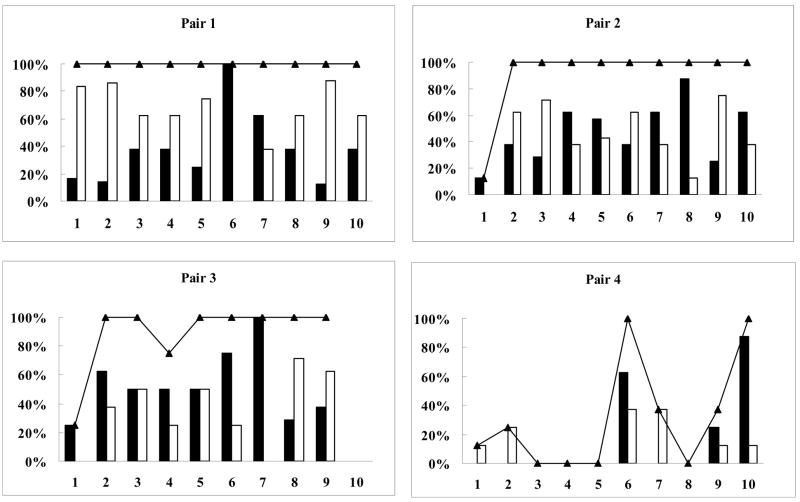
Figure 5.
Percentage of trials solved and percentage of rewards received in experiment 3, Centered Reward. X-axis represents session. The line indicates the percentage of trials solved. Black bars indicate the percentage of rewards received by the female (percentage calculated out of total number of rewards possible each session regardless of whether the trial was solved), white bars represent the percentage of rewards received by the male. Pair 1 is the only pair in which one partner received significantly more rewards than the other (P = 0.025).

