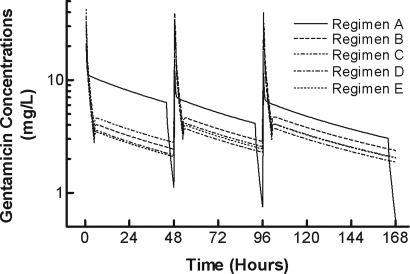
Figure 2.
Gentamicin mean concentration-time profiles for simulated dosing regimens A (solid line), B, C, D, and E (hatched lines). The profiles are shown for the intradialyitic and interdialytic periods for one week after the administration of the first drug dose. The times for the dialysis session were 44 to 48, 92 to 96, and 164 to 168 h.

