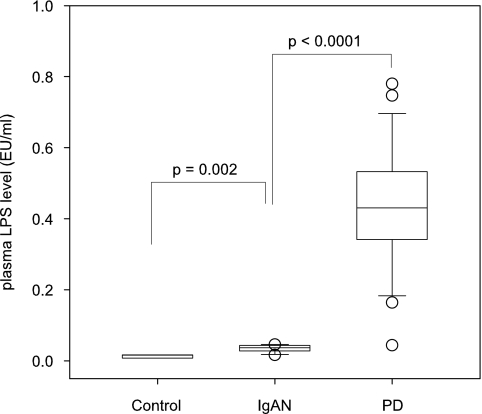
Figure 1.
Comparison of plasma lipopolysaccharide (LPS) level between patients on peritoneal dialysis (PD), chronic kidney disease secondary to Ig-A nephropathy (IgAN) and controls. The boxes indicate median, 25th, and 75th percentile; whisker caps indicate 5th and 95th percentile; open circles indicate outliers. (Overall Kruskal-Wallis test, P < 0.0001.)

