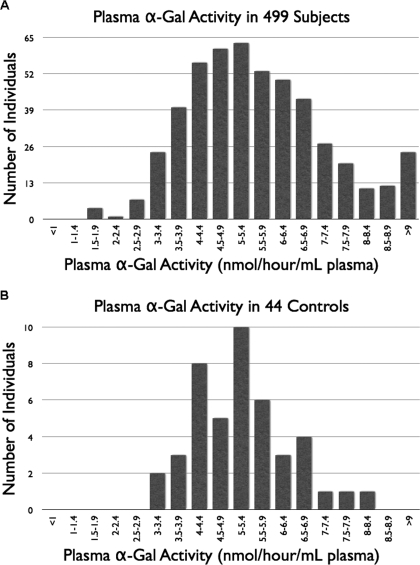
Figure 1.
(A) Upper histogram. Plasma α-galactosidase results in the study cohort of patients with chronic kidney disease (CKD; n = 499; observed range of activities 1.6 to 23.8 nmol/h per ml plasma; median 5.5; mean 5.8). Eleven patients had α-galactosidase activity below the second percentile of this group (<3.0 nmol/h per ml plasma). (B) Lower histogram. Plasma α-galactosidase in healthy control subjects (n = 44; observed range of activities 3.0 to 8.1 nmol/h per ml plasma; median 5.2; mean 5.2).

