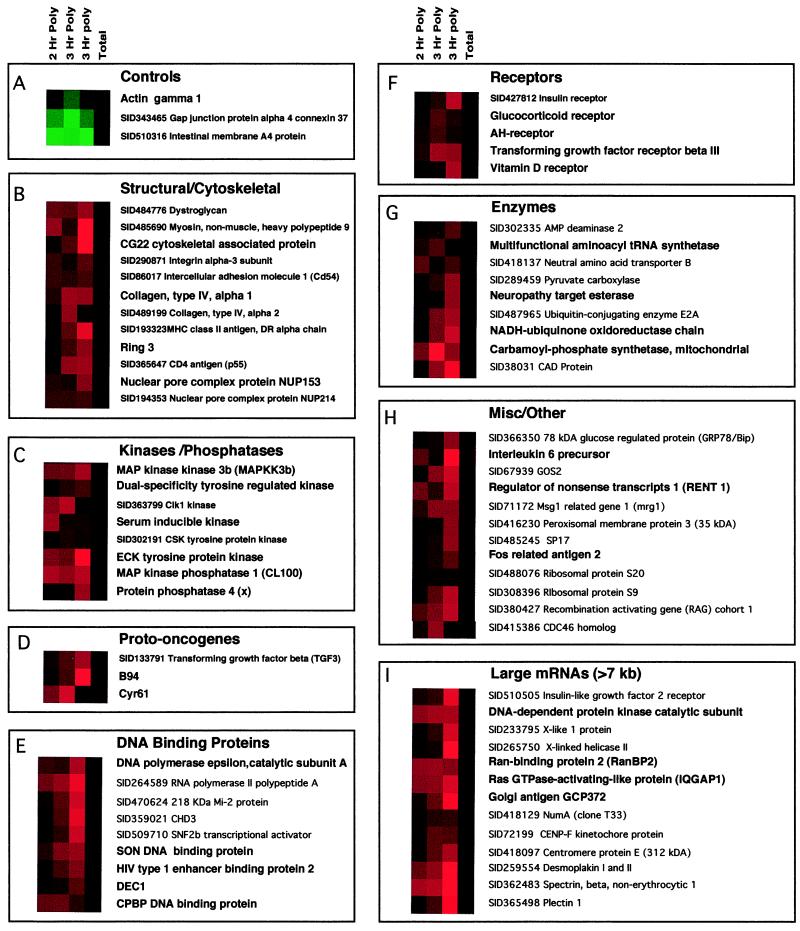
Figure 2.
Polysomal association of cellular mRNAs during poliovirus infection. Each colored square represents the ratio of total mRNA level in the cell (Total) or present on high molecular weight polysomes (Hr Poly) at different times after infection, relative to the same mRNA level in mock-infected cells (28). Black squares denote no significant change in the amount of RNA in infected and mock-infected cells; red squares denote RNAs that are more abundant in polio-infected cells, and green squares denote RNAs that are more abundant in mock-infected cells. The intensity of the color is proportional to the log2 of the fold increase/decrease, with maximal intensity corresponding to an 8-fold increase/decrease. Variations in intensities result from different hybridization reactions and different batches of chips. Panel A shows three genes whose expression pattern typifies that found in ≥97% of the genes on the microarray. (B–I) Named genes whose RNA levels were enriched >2-fold in polysomes from infected cells (2 Hr and 3 Hr Poly, shown in two independent experiments) but displayed no significant changes in their steady state levels (Total) are grouped within the following categories: Structural and Cytoskeletal (B), Kinases and Phosphatases (C), Proto-oncogenes (D), DNA Binding Proteins (E), Receptors (F), Enzymes (G), Miscellaneous and Other (H), and mRNAs larger than 7 kilobases (kb) (I). The clones are identified by either a name or preceded by a Stanford identification number (SID); SID-marked genes have not yet been verified by sequencing. However, ongoing sequencing of the clones has shown that 80% of the clones can be successfully verified.

