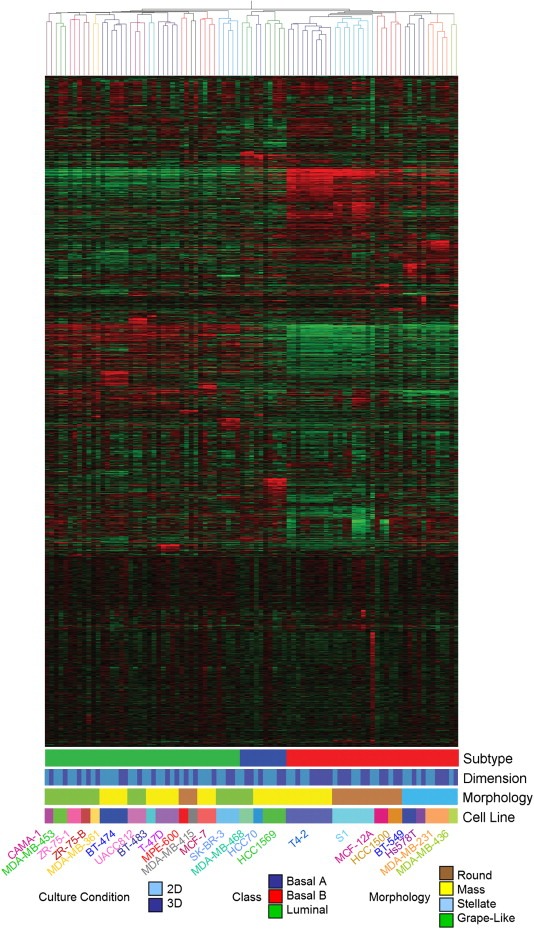
Figure 4.

Gene expression profiling of breast cell lines grown in two‐ and three‐dimensions. Unsupervised hierarchical clustering of 89 samples representing 24 non‐malignant and malignant breast cell lines cultured on either tissue culture plastic (2D) or lrECM (3D). Tree branches are colored to indicate cell line identity (see key on bottom of figure). Also colored in the key are the morphological group and the tumor classification to which each cell line belongs.
