
Figure 6.
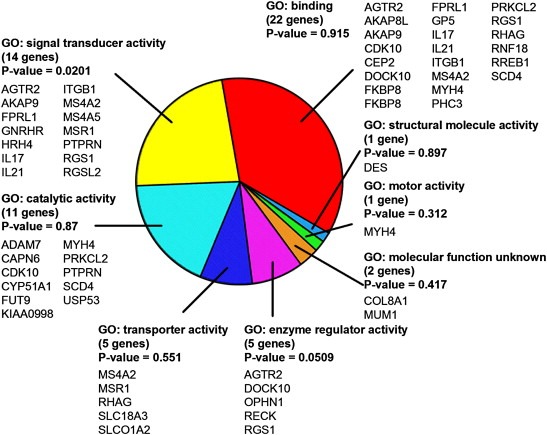
Gene Ontology analysis of genes distinguishing cells grown in 2D and 3D culture conditions. Gene Ontology analysis of the 41 of the 96 genes shown in Figure 5 for which Gene Ontology annotations were available. Genes encoding proteins involved in signal transduction are significantly overrepresented in this set (P=0.0201), while genes encoding proteins involved in the regulation of enzyme activity almost achieved statistical significance (P=0.0509).