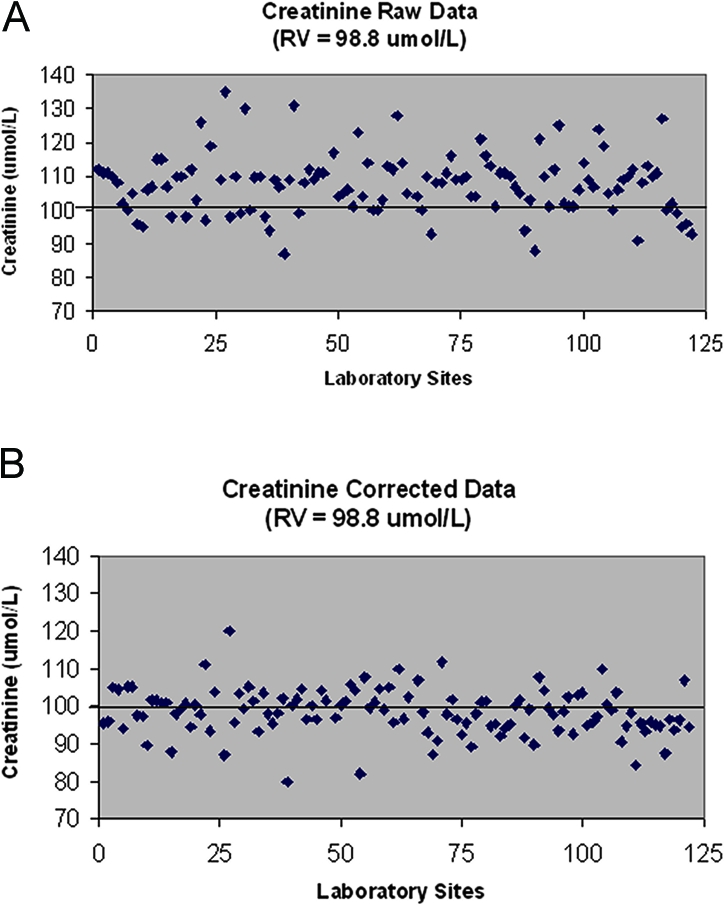
Figure 2.

(A) Unadjusted creatinine performed on one test sample from each of the 107 laboratories in the province as compared with the reference sample. (B) Adjusted creatinine according to the assigned calibration correction equation for each laboratory. RV, reference value.
