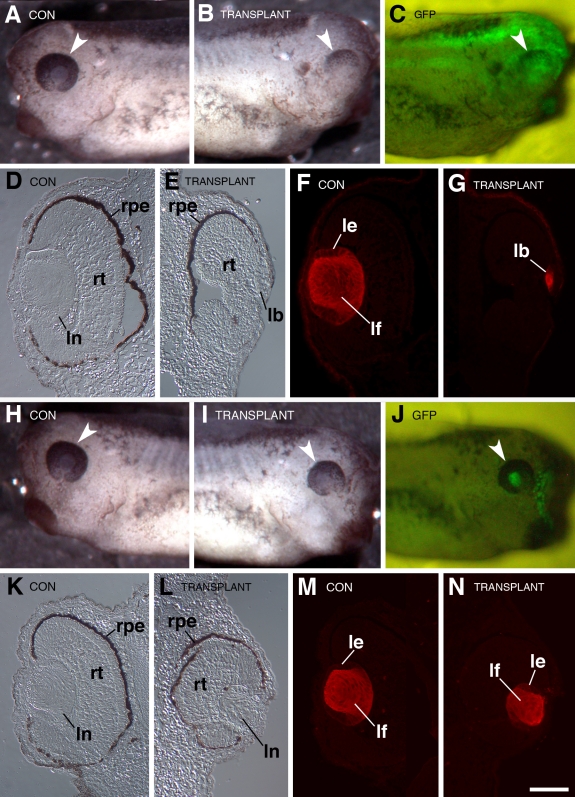
Figure 7.
Examples of the results observed from reciprocal presumptive lens ectoderm transplants between control and Psf2MO-injected embryos. Dorsal is toward the top in each figure. Arrowheads point to eyes in the whole mounts shown in A-C and H-J. A-G: This example shows the typical result that is observed when the presumptive lens ectoderm from a control embryo is transplanted to the lens-forming region of a Psf2MO-injected host (see Figure 5, the text, and Figure 6). A: The view of the control (“CON”), unoperated side of the larva is shown. B: The view of the operated side that received the transplanted PLE (“TRANSPLANT”) shows abnormal development of the retina and lens. C: The whole mount fluorescence image corresponds to that shown in B, which reveals the location of the transplanted ectoderm via distribution of GFP expressed in the donor tissue (“GFP”). D and E: High magnification DIC images of transverse sections through the control side (D) and the operated side that received the transplanted tissue (E) are displayed. F and G: Corresponding immunofluorescence images show anti-lens antibody staining of the sections shown in D and E, respectively. Note formation of an abnormal retina and small lens body in E and G. H-N: This example shows the typical result that is observed when the presumptive lens ectoderm from a Psf2MO-injected embryo is transplanted to the lens-forming region of a control host (see Figure 5, the text, and Figure 6). H: The view of the control (“CON”), unoperated side of the larva is shown. I: The view of the operated side that received the transplanted PLE (“TRANSPLANT”) shows smaller overall size of the eye. J: The whole mount fluorescence image corresponds to that shown in I, which reveals the location of the transplanted ectoderm via distribution of GFP expressed in the donor tissue (“GFP”). K-I: High magnification DIC images of transverse sections through the unoperated, control side (K), and the side that received the PLE transplant derived from the Psf2MO-injected embryo (L), are shown. M and N display the corresponding immunofluorescence images showing anti-lens antibody staining of the sections presented in K and L, respectively. Note that the retina and lens formed on the operated side (L and N), although smaller compared to the unoperated side (K and M), exhibit fairly normal morphology. Labels are the same as those used in Figure 4. lb stands for lens body. The scale bar in N is equal to 450 µm in A-C and H-J and 80 µm in D-G and K-N.

