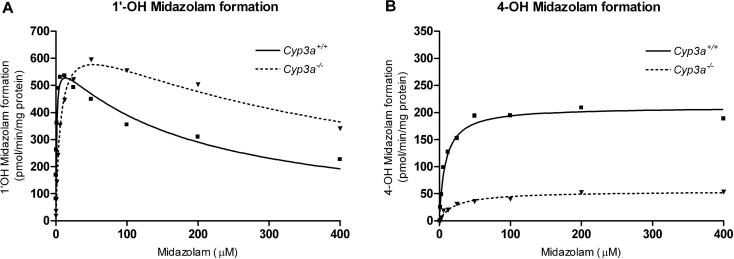
Figure 1.
Representative plots of 1’-OH midazolam (A) and 4-OH midazolam (B) formation by liver microsomes of Cyp3a+/+ and Cyp3a−/− mice. Incubations were performed as described in Materials and Methods. The corresponding kinetic parameters are summarized in Table 1.

