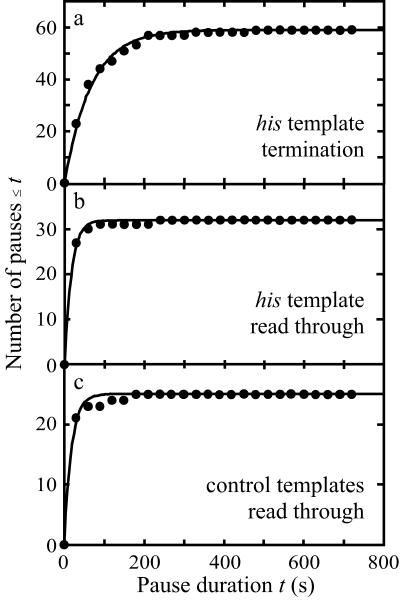
Figure 3.
Cumulative frequency distributions of pause durations in the his terminator region (or the equivalent region of control templates). Complexes that terminated in (a) or read through (b and c) the region were analyzed separately. Each point shows the number of observed pauses with durations less than or equal to the indicated duration t. The lines indicate least-squares fit of the data to an exponential distribution function (see Methods) with time constants of 67 s (a), 17 s (b), and 18 s (c).

