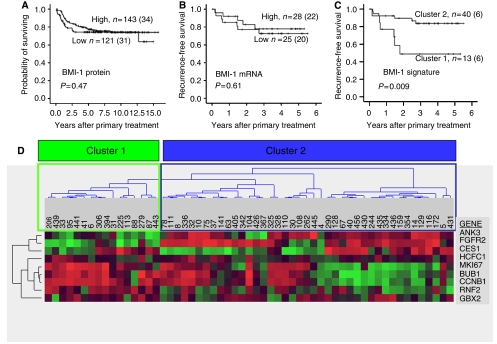
Figure 4.
Expression of (A) BMI-1 protein, (B) BMI-1 mRNA, and (C) cluster for BMI signature activation related to survival. Survival curves estimated according to the Kaplan–Meier method with death due to endometrial carcinoma as end point in panel A and time to recurrent disease as end point in panels B and C. Nine out of 11 genes in the BMI-1 signature were identified in the present data set. Unsupervised hierarchical clustering (WPGMA; Pearson's correlation) gives a cluster formation where tumours in cluster 1 have significantly lower recurrence-free survival as compared with tumours in cluster 2 (P=0.009, C and D).

