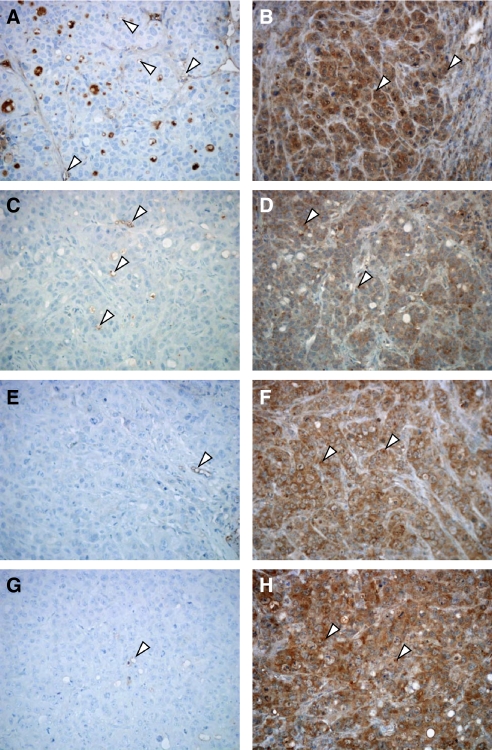
Figure 6.
Representative images of immunohistochemistry of mouse CD31 and human VEGF in HT-29 xenografts in vehicle-treated mice (control group) (A and B, respectively), in CPT-11 100 mg kg−1 i.p. every week (MTD schedule) group of mice (C and D, respectively), in metronomic CPT-11 4 mg kg−1 i.p. daily group (E and F, respectively) and in the group treated with an initial single dose of CPT-11 100 mg kg−1 i.p. followed by metronomic CPT-11 4 mg kg−1 i.p. daily (G and H, respectively). Arrowheads, positively stained cells. Magnification, × 200.

