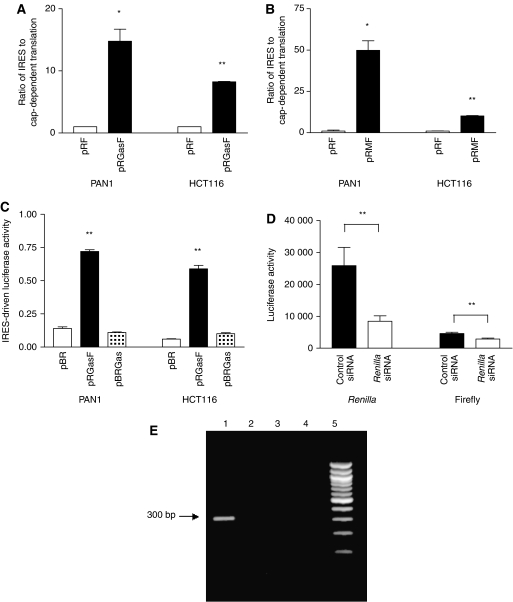
Figure 3.
Activity of the putative gastrin IRES and Myc IRES in pancreatic (PAN1) and colon (HCT116) cancer cell lines. Basal activity of (A) the gastrin IRES (pRGasF) or (B) Myc IRES (pRMF) compared with empty vector (pRF). (C) Activity of the gastrin IRES in a promotorless plasmid (pBRGas) compared with the empty vector (pBR) or pRGasF. (D) Significant knockdown of both Renilla and firefly luciferase activity in HCT116 cells transfected with pRGasF and a Renilla siRNA, compared with cells transfected with pRGasF and a control siRNA (P<0.005 for both). (E) Reverse transcriptase-PCR of cells transfected with pRGasF using forward and reverse primers located within the Renilla and firefly luciferase sequences. A single band of ∼300 bp was observed (Lane 1). No bands were observed in the RT-negative, cDNA reagent and RNA isolation controls (Lanes 2–4). Lane 5: markers. Statistical significance is indicated by *P<0.05 or **P<0.01.

